Stated by: Bill Tieleman, spokesperson for the official NO campaign, Globe and Mail, July 1, 2018. No to PR campaign on Twitter.

Fact Check
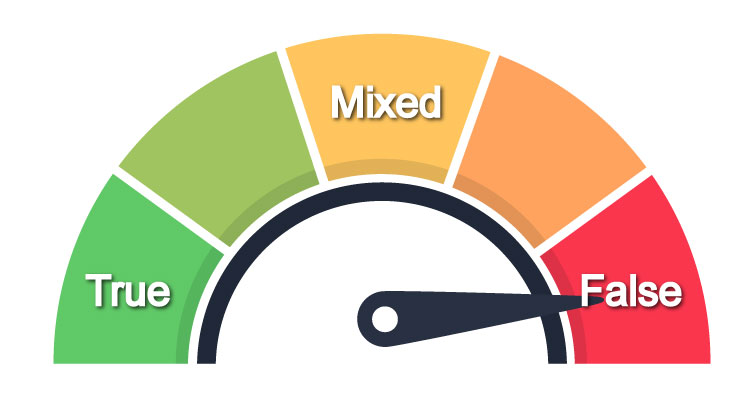
This claim is mostly false. There is nothing to substantiate it in terms of the experience of voters. However, the formula to determine the winners used by Elections BC is more complex than first-past-the-post.
“Simplicity” can refer to three things:
- How easy it is for voters to fill out their ballot
- How easy it is for voters to understand the results
- How Elections BC counts the ballots (the formula) to get the results
Simplicity of use for voters
How “simple” a voting system is to use is a highly subjective opinion. There are simply no comparative studies asking voters in different countries how “simple” they think their electoral system is to use or to understand.
Therefore we can only infer how simple proportional representation is to use is by looking at other measures. For example:
- Voters in about 102 countries use proportional or mixed systems, making systems with proportionality the most common in the world.
a - Almost all new democracies adopt proportional representation. The trend around the world is towards more proportional systems and towards systems that give voters more choice. Colomer (2005) finds: “more than four-fifths of today’s democracies in countries with more than one million inhabitants use electoral systems with proportional representation rules (80.5 percent), while less than one fifth use majoritarian rule systems (19.5 percent).” 1
a - According to the Ace Electoral Knowledge Network (Table 1), of 31 countries which have changed their electoral systems in the past 20 years, 27 increased the proportionality in their electoral system and only one moved in the opposite direction.”Based on the popularity of proportional systems, it is possible but counter-intuitive that most countries would adopt systems that are too difficult for their voters to use.
a - Many studies have replicated the finding that countries using proportional systems have a higher voter turnout – anywhere from 5-10% higher depending on the study. The most comprehensive work was done by Arend Lijphart, looking at 36 countries over about 55 years. (That does not mean that proportional representation will increase turnout in BC – see Fact Check here). One can logically conclude from this that proportional ballots are not deterring citizens from voting.
a - Although there there has been no exhaustive comparative study of “spoiled ballots” across countries, the rates of spoiled ballots in Sweden, Ireland and Badden Wuttermburg Germany were .9%, .9% and 1% respectively in their last elections. These citizens use systems similar to those on the ballot in BC. In comparison, the rate of spoiled ballots in Canada’s last election was much the same, at .7%. It is impossible to tell how many spoiled votes were due to complexity versus individuals choosing to invalidate their votes.
How well voters understand the results
There are no comparative studies assessing how well voters in different countries understand the results of their electoral systems.
Research does show that voters in countries with proportional systems score higher on levels of political knowledge (Segura, 1997 & Milner, 2014).
Advocates of first-past-the-post will say that it is the simplest system to understand in terms of results, because the candidate with the most votes wins each riding. The claim that FPTP is simpler to understand at the riding level is a plausible one.
However, it is considerably less clear whether most voters could explain how riding level results translate into overall results in the legislature with first-past-the-post: how a single party with 40% popular support can win a majority government, sometimes 60% or more of the seats. Advocates of proportional representation would argue that overall results in the legislature are simpler to understand with proportional representation: 30% of the vote = 30% of the seats.
Recent research from Sweden (which uses a system similar to Rural-Urban Proportional) shows that voters engage in a rather sophisticated form of strategic voting to achieve the nuanced outcomes they want. In New Zealand (which uses Mixed Member Proportional) about 30% of voters “split their ticket” – giving their local vote and party vote to different parties. These examples suggest a high level understanding of how votes translate to seats among a substantial number voters in those countries, but there is just no research comparing their levels of understanding with that of Canadians.
How Elections BC Counts the Ballots to Get the Results
Every voting system uses a “formula” of some sort to determine the winners, with the counting administered by an impartial electoral body (like Elections BC).
Different formulas have been used in British Columbia in the past, at the municipal and provincial level, as well as in other provinces. Alternative Vote was used in BC in the 1950’s, at-large voting is used municipally in many cities, Single Transferable Vote and Alternative Vote were used provincially in Alberta and Manitoba for 30 years.
Although there is a good deal of subjective opinion about how complex the counting formulas are for the three options proposed for the BC referendum ballot, opponents are correct that counting the ballots with the proportional options for BC is more complex than first-past-the-post.
However, voters do not need to perform these calculations themselves in any country, so it is unclear if more complexity for Elections BC is related to voter perceptions of complexity.
